
.webp)
What was expected to be a relatively benign period for financial markets has been upended by the outbreak of the COVID-19 virus, causing an unprecedented response. The MSCI World index, a proxy for developed market equities, took just 15 trading days to fall into bear market territory - defined as a 20% price fall - from its 2020 peak on 19th February. Then, just as dramatically, following historic monetary intervention by the Federal Reserve of the United States, the index saw it’s fastest ever return to a technical bull market - defined as a price rise of 20% - in just 13 trading days.
Governments have not shied away from unprecedented fiscal support to counteract the economic vacuum either. Globally, over $9 trillion in fiscal stimulus measures has been pledged, with direct government spending by the G20 group of nations expected to be over 3.1% of GDP (gross domestic product), versus just 2.5% of GDP during the global financial crisis (GFC) of 2008/2009. The pace and turn of such events has left many investors and market commentators wrong footed.
Turning to the real economy and, with many countries emerging from lock-downs, the initial signs of recovery look encouraging across a number of data points. Manufacturing and service sectors are seeing month-on-month signs of recovery and mobility data from the likes of Google show that people are starting to return to their old travel lives, and hopefully, spending habits as well.
Yet, we are still some way off returning to pre-COVID-19 levels of economic activity. The IMF (International Monetary Fund) is expecting global GDP growth to decline by 4.9% in 2020. Whilst the World Health Organisation (WHO) continues to stress that we are still in the early stages of this pandemic, with a number of regional virus hotspots remaining and case flare ups threatening countries, which are now emerging from their lock-downs.
Placing the macroeconomic commentary to one side, what has actually happened in financial markets so far this year? How have different asset classes, industries and investment styles performed? And depending on the trajectory of the pandemic, what could this mean for markets moving forward? All of the above is discussed in this market update.
Asset Class performance
The importance of asset class diversification is laid bare in the diagrams below. Fixed income debt is represented by government (sovereign) bonds, investment grade corporate bonds and high yield (sub investment grade) corporate bonds, typically issued by more risky/indebted businesses. For equities, the MSCI World index is a proxy for international exposure, whilst UK equity exposure can be observed via the FTSE 100. And lastly, gold, a ‘safe haven’ asset and proxy for risk-aversion.
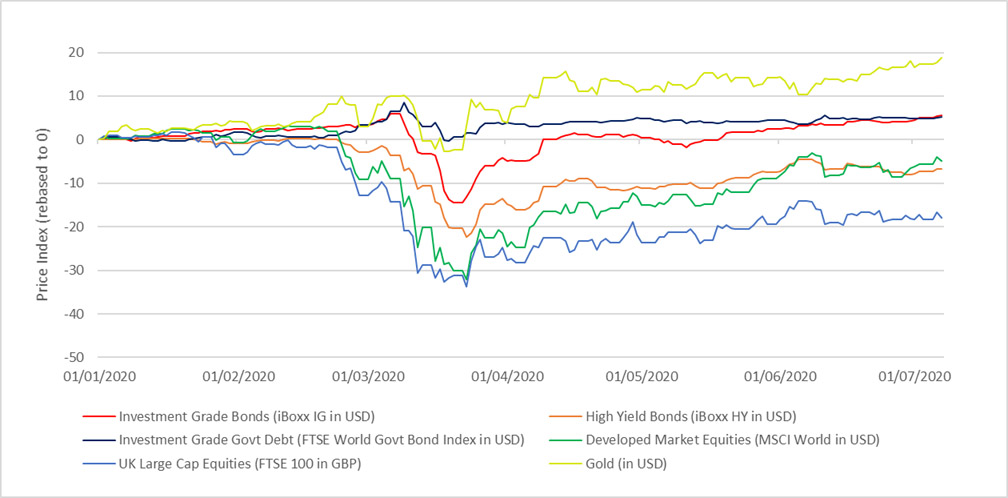
Source: Bloomberg
The figures used refer to the past. Past performance is not a reliable indicator of future results.
Fixed Income
The 19th of February 2020 marks the date from which markets appear to have collectively woken up to the threat from COVID-19. Within fixed income debt, government and investment grade corporate bonds initially performed positively, as investors moved their holdings into the perceived safety of these assets. The same cannot be said for high yield bonds, where the higher credit risk of underlying businesses, led investors to reduce their exposure to the asset class, resulting in a negative initial performance.
As the economic severity of COVID-19 induced lockdown measures and the likely duration of disruption became clearer to markets, concerns mounted around the cash flow implications for all institutions. This led to a wave of panic selling in which all fixed income asset classes fell. High yield disproportionally more so, as investors became fearful of an impending wave of bankruptcies from highly indebted businesses, and aggressively moved to offload their exposure, causing high yield debt prices to plummet by -23% from its pre-COVID-19 peak.
The dramatic turning point for fixed income markets, and indeed most other financial markets, was the historic speed and magnitude of monetary intervention announced by the Federal Reserve (The central bank of the US) on 23rd March 2020. Not only were base rates slashed to near zero, much more quickly than in the global financial crisis (GFC) of 2008/09, but the Fed also pledged a range of credit facilities and “unlimited” quantitative easing (QE), a marked change to its stance during the GFC. Up until the period ending the 30th March 2020, the Fed had conducted nearly $4T of QE, nearly the same as the $4.5T of QE purchases it made during the entire November 2008 to October 2014 period. The icing on the cake was the announcement on the 9th April 2020 that, for the first time in history, the Fed would extend its QE program to the high yield bond market. These measures collectively signalled that the Fed would provide whatever monetary funding was needed to prevent what was turning into a liquidity crisis for many public and small companies across the US, and indeed the world, into a full-blown financial and economic crisis. For the time being, this has appeared to put a floor to fixed income price declines, preventing a huge wave of initial COVID-19 bankruptcies and has had a positive spill over effect to most other financial markets.
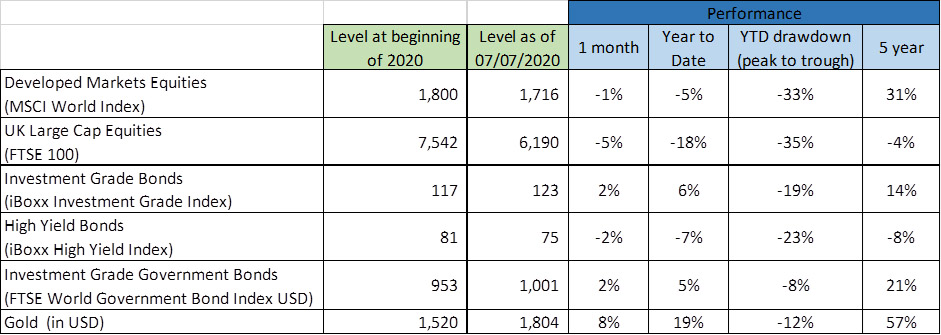
The intervention of the Fed, coupled with the reopening of economies from lock-downs, has re-kindled some risk-on investor sentiment. This led to the relative performance of riskier assets, such as high yield debt, being stronger since the mid-march trough in markets. The actions of the Fed, coupled with the reopening of developed economies from lockdown, meant that despite the macroeconomic environment looking much more uncertain than at the beginning of the year, government and investment grade debt is in positive territory year-to-date (YTD). In a turn of events, the performance of high yield debt now stands at just -7% versus the -23% drawdown seen from its pre-COVID-19 peak to its March trough.
Equities
Equities had a similar but more amplified price reaction to that of high yield. The MSCI World index has performed better than our home index of the FTSE 100, with YTD performance of -5% versus -18% for the FTSE. This is due to the much larger weighting of the MSCI World index towards technology and healthcare companies (c.35% of index’s weighting vs. c.15% for the FTSE 100), which have proven to be more resilient during the COVID-19 period. The FTSE 100 is also more exposed to cyclical sectors such as financials, materials and energy (c.40% of the index’s weighting vs. c.20% for the MSCI World index) which felt the recessionary impact of the coronavirus more severely. Such disparity in sector exposure lends even more credence to the importance of geographical and in turn sector diversification.
Gold
Gold’s +19% YTD performance has been the strongest of the asset classes under observation, benefitting from its safe haven status. As COVID-19 fears arose in February, gold initially performed well, rallying c.10% from the beginning of the year. In early-to-mid march, intense selling of equities and high yield bonds did have a knock on impact to gold, as some traders and investors sought to raise cash. This resulted in a gold price drawdown of -12% at one point, albeit from an already elevated level, pushing the asset class into a slight negative performance for the year. However, following the intervention of the Fed, gold recovered strongly and now remains at an elevated level. Partly because of lower global interest rates and a weaker US Dollar (cheaper for non-US Dollar paying international buyers), but also because investors still have a lingering concern about the longer-term macroeconomic damage caused by the COVID-19 pandemic.
Industry performance
Focusing on equities, and in particular the US - the largest equity market globally - the winning and losing companies from the COVID-19 period can clearly be identified.
The table below shows the top 10 best performing and worst performing sub industries of the S&P 500 index, the largest 500 companies by market capitalisation in the US.
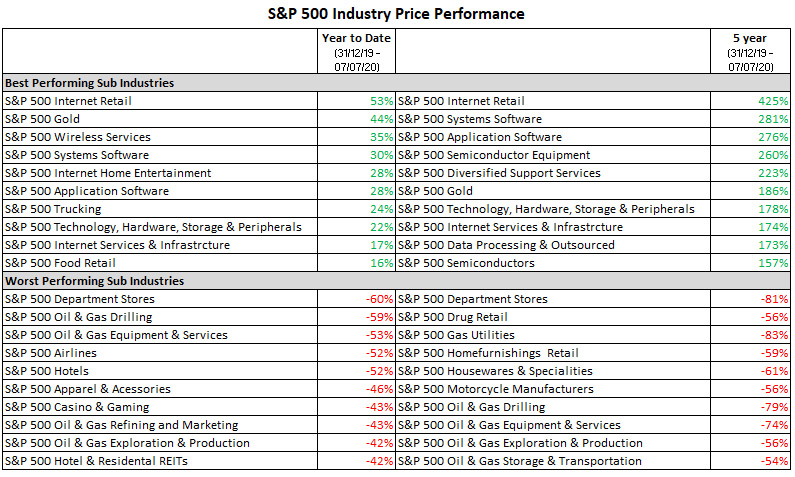
Source: Bloomberg
The figures used refer to the past. Past performance is not a reliable indicator of future results.
The various sub industries of the technology sector have unsurprisingly led performance, as social distancing measures have forcefully increased consumer and business reliance on the likes of internet retail (e.g. Amazon), system and application software (e.g. Microsoft & Adobe) and interactive home entertainment i.e. gaming (e.g. EA & Activision).
The worst performing industries are expectedly those directly affected by social distancing measures, such as department stores, apparel, casinos and travel. But also those most impacted by the resulting economic fallout, such as the various sub industries of the oil & gas sector.
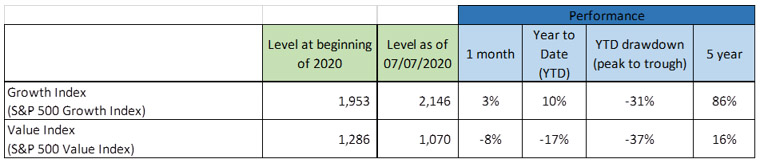
Investment style performance
Divergence in performance can also be seen in investment style. The two main investment styles of value - investing in the share of companies that are considered to trade cheaply relative to their fundamentals - and growth – investing in shares of companies that are expected to grow faster than the average growth rate for the market - have experienced vastly different levels of performance levels.
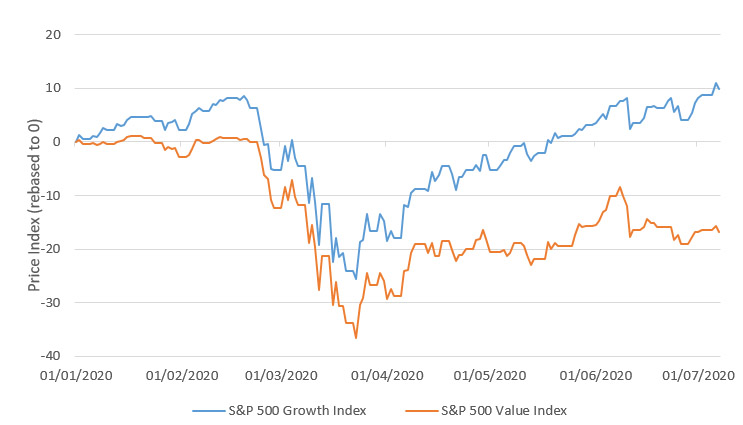
Source: Bloomberg
The figures used refer to the past. Past performance is not a reliable indicator of future results.
Growth stocks have significantly outperformed value stocks YTD. There are a number of reasons for this, including the positive impact of declining interest rates on the valuation of growth companies, but perhaps the most important is that the industries which growth companies typically operate in, such as those of the technology and healthcare sectors, have proven to be financially more resilient to, and in some cases actually benefitted from, the outbreak of COVID-19. Value stocks, however, typically operate in the more cyclical industries of physical retail, travel and oil & gas. These have been disproportionately impacted by not only the economic fallout of COVID-19, but also directly by social distancing measures. Investors have thus been willing to pay a premium for the earnings growth and visibility provided by some growth stocks.
The performance of growth stocks does however come against a backdrop of ominous market movements. Global government bond yields have fallen significantly; the US 10 year treasury note - the effective interest rate that the US government borrows for 10 years at - has dropped from 1.92% (31/12/19) to just 0.64% (07/07/20). The price of ‘safe haven’ gold has moved substantially higher (+19% YTD) and cyclical value stocks have performed poorly (-17% YTD). It should also be highlighted that positive stock price performance has been heavily concentrated: tech stocks have primarily fuelled the equity market recovery from the March nadir. The five largest stocks of the S&P 500 - Facebook, Apple, Amazon, Alphabet (i.e. Google) and Microsoft – all tech names, now account for over 25% of the index’s weighting. This concentration is far more than in the dot.com bubble in 2000, when the five largest companies of the index accounted for 18%. Collectively, all of these market movements are signs of lower investor confidence and suggest concern in broader global economic growth.
What could be the scenarios for markets moving forward?
The recessionary macroeconomic backdrop we currently face has been induced by the outbreak of the COVID-19 virus. The outlook for aggregate demand in the global economy, inflation, interest rates and ultimately financial markets, is therefore dependent on the trajectory of COVID-19, which no one can truthfully predict.
Focusing on three potential COVID-19 scenarios, some assumptions about what the outlook for financial markets could be:
- Case numbers in major economies continue to fall. This is followed shortly by a widely available health solution(s) to the virus being found soon, such as a vaccine, with pre-COVID-19 levels of economic activity returning shortly after.
- Case numbers in major economies continue to fall, but will be marred by sporadic viral flare ups and/or relatively small second waves, which force local lockdown measures. Major economies continue to recover but a ceiling is effectively placed on economic activity, below that of pre-COVID-19 levels, until a health solution(s) becomes widely available.
- Before a health solution is found, significant further waves of the virus hits major economies, forcing them to go back into de jure lockdowns, or de facto as a result of self-enforced lockdown measures by consumers and businesses. This causes a significant further contraction in global economic growth.
So, how might markets react under these scenarios?
In scenario 1, we could expect to see most financial assets perform positively, but risk assets, such as equities, commodities and high yield bonds, would outperform. Equities would likely see the strongest relative performance, particularly from cyclical value stocks, as a broad economic recovery would now take hold, meaning such companies are more likely to survive and flourish. Relative to value, growth stocks would be expected to experience a period of relative underperformance as the earnings growth they offer, relative to their risk profile, would become less attractive. High yield bonds would likely follow equities and significantly outperform more risk-off assets, such as government and investment grade corporate debt, as broad economic growth would result in bankruptcy risk subsiding. The only likely loser would be gold, as more certainty over the macroeconomic outlook would cause market fear to diminish.
For scenario 2, the outlook is harder to forecast. Earnings growth of companies could slow, and along with the flow of good and bad COVID-19 related news, would likely cause equity markets to move in side-ways directions until a health solution was found. COVID-19 insulated growth stocks would continue to be viewed more favourably than value stocks and other asset classes in terms of relative performance. Some bankruptcies of highly leveraged businesses would still likely occur if pre-COVID-19 levels of economic activity are not achieved in sufficient time. This would cause high yield debt to underperform, relative to government and investment grade corporate bonds, which would likely see positive performance given their defensive qualities. Gold would stay at elevated levels given continued market uncertainty.
Scenario 3 would see most financial assets perform negatively, but risk assets considerably more so. Equities would bear the brunt, particularly value stocks, and a rise in bankruptcies for heavily indebted companies would likely cause high yield debt to underperform other fixed income assets; reflecting the similar performance trend seen in March/April. Collectively, government bonds and investment grade debt would likely perform slightly negatively but hold up relatively well. Whilst safe heaven government debt such as US treasuries would rally. The increasing market uncertainty would cause gold almost certainly to perform the strongest in this period.
Uncertainty remains
In any scenario, it is unclear how governments and central banks would react, which would undoubtedly have a big impact on financial markets, akin to the Federal Reserve’s intervention announcements in March/April.
Regardless of the path COVID-19 takes, what is clear is that a number of unknowns continue to cause uncertainty. The ‘easy wins’ from the easing of lock-downs in major economies have been seen, the question now to ask is how quickly economic growth can return to pre-COVID-19 levels? This is largely dependent on whether there are further disruptive waves of the virus, and ultimately when we attain a successful health solution to it. No sustainable economic recovery can happen until then.
The current period we are living through demonstrates the importance of having a diversified portfolio, not just across asset classes but geographies and sectors also. This is ingrained within our approach to investment management at JM Finn, alongside our preference to invest in quality businesses, which retain unique competitive advantages and have attractive structural growth prospects. Our approach helps us to continue to look to support the long-term investment objectives of our clients, now and beyond the immediate impacts of COVID-19.


