


With strong vaccination rates in the US and the UK, and with Europe catching up quickly, we are seeing many economies gradually unlocking and consumers and businesses start to spend. As an example of the swift rebound, UK April 2021 retail sales were +9.2% month-on-month, double the forecast, as consumers spent the circa £100bn of cash savings they had set aside over the past year, while leading indicators for business are at their most positive levels for years. The US Institute for Supply Management (ISM) Manufacturing Index came in at 64.7 at the end of March, the highest level since 1983 (a reading above 50 is expansionary), while the ISM Services survey came in at 63.7, an all time high. In addition, many of us will have seen or read news articles on the shortage of bricks and timber in the construction sector, while most builders are inundated with requests from homeowners looking to re-model their homes. The number of skips on neighbouring streets is proof enough of the good times they are now experiencing! Furthermore, the shortage of semi-conductors has resulted in many car production lines slowing, while second-hand car values have surged, given the tight supply. It therefore comes as no surprise that many are concerned that inflation is returning with a vengeance.
However, the counter argument is that we are just recovering from near zero inflation due to the pandemic and therefore, some return of inflation should be expected. This has been the line adopted by the Chairman of the US Federal Reserve, Jerome Powell, who speaks of ‘transitory’ inflation, and was backed up by our own Governor of the Bank of England, Andrew Bailey, who recently reported to the Treasury Select Committee: ‘these transitory developments should have few direct implications over the medium term’. Interestingly, it does go against the advice of Andy Haldane, the outgoing Bank of England Chief Economist, who is warning of higher and more sustained inflation.
Markets are certainly acknowledging a concern that inflation could be returning. For example, the yield on the US 10 year Treasury Note has increased from 0.9% at the turn of the year, to 1.6% today (27th May 2021), while the UK 10-year Gilt yield has moved from 0.2% to 0.8% over the same period, these are significant moves for what should be a pretty stable asset class. In performance terms the FTSE UK Gilt Index has fallen -6.1% in total return terms between the 31st December 2020 and the 26th May 2021 inclusive (data from Bloomberg), while the FTSE All-Share Index has gained +10.8%.
The Bloomberg chart below shows the UK’s FTSE All-Share Index (orange) tracking the US S&P500 Index (dark blue line), while the more growth orientated Nasdaq Index (red line) has been more volatile. Added to this, we include the FTSE UK Gilt Index in light blue, which shows how soft the fixed income markets have been:
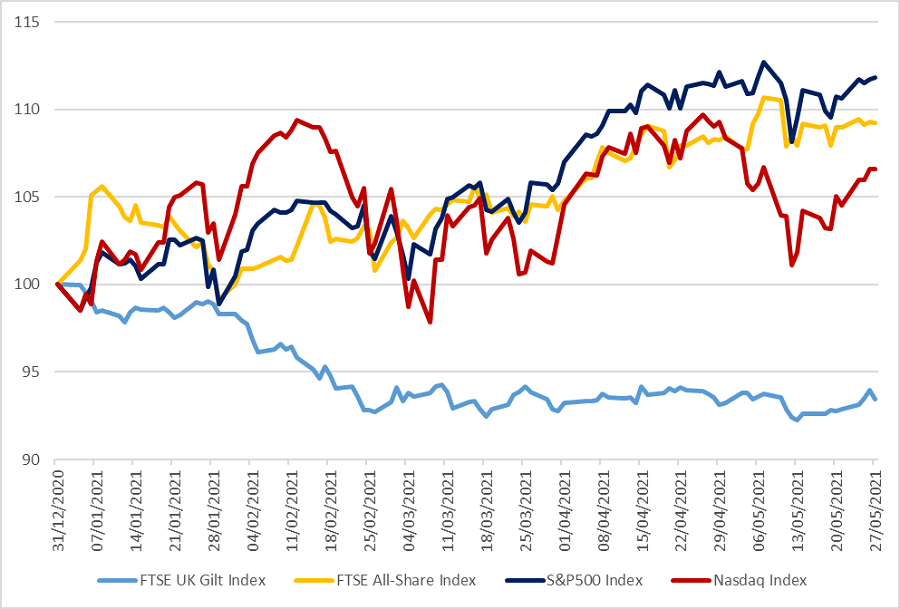
Source: Bloomberg Data from 31/12/2020 to 27/05/2021
The value of investments and the income from them can go down as well as up and investors may not get back the amount originally invested. Past performance is not a reliable guide to future returns.
So, while the fixed income markets have been weak so far this year, by looking at the yield curve charts we can perhaps deduce how the fixed income markets could perform going forwards, and in turn, work out if inflation is re-entering the global markets. The chart below is of the US yield curve of the largest, most liquid fixed income market in the world and the driving force behind all global markets, and hence why this is so important to look at. The position and shape of the yield curves is critical in understanding where we might be going – the solid green line is the current yield curve, the dotted beige line representing yields a year ago, and the dotted green line showing yields three years ago. The chart tells us that three years ago, yields were higher than they are now (they were historically low, but with yields rising from c1.7% at 1 month to 3.0% at 10 years), but with the coronavirus pandemic, yields collapsed down to the dotted beige line. One year on, yields are recovering and they have risen to higher levels than they were a year ago, however, the curve as a whole remains subdued compared to 3 years ago. In plain English, the message of the yield curve is that we are recovering from the pandemic lows and inflation and interest rate expectations still remain well below where they were 3 years ago:
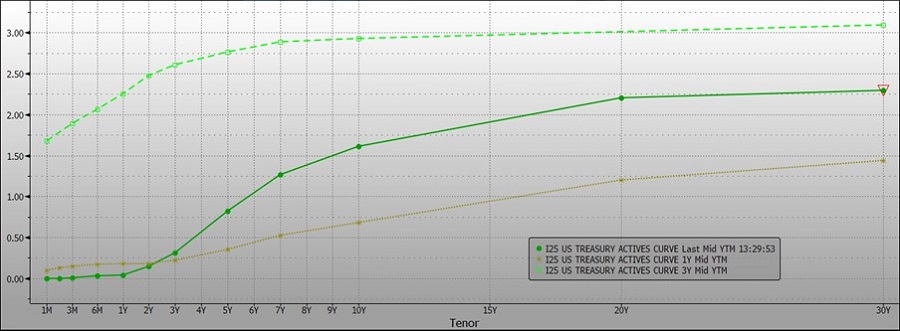
Source: Bloomberg, as at 27/05/2021
In other words, while the yield curve chart is suggesting inflation is returning, at the current time inflationary pressures are not at levels to be worried about, and so we are likely to remain in a ‘lower for longer’ scenario, as we have been for the last 10 years. As an example, when the UK consumers’ £100bn has been spent, then that is it, and the same goes for corporate savings. The US Federal Reserve is still expected to raise interest rates in late 2022/early 2023, while the global economy is expected to continue to recover, over the coming 18-24 months.
In summary, while we should be prepared for inflation, we do not believe this will be a long term feature and certainly not anything like the late 70s/early 80s. Technological gains in the workplace and society remain the large disruptor, cutting huge costs out of business and the global economy. Furthermore, if we do indeed see rising or recovering inflation then the asset allocation call could be less cash and fixed income assets (gilts and bonds) and more real assets, which includes equities, infrastructure and property.
So almost regardless of the scenario going forward, whether it be ‘lower for longer’ yields, or a short term inflationary spike, investors are being forced to take on the volatility and returns from the equity markets.
Mark Powell, Investment Director and Head of Charities
Mark is head of Charities at JM Finn. All views are those of the author and not necessarily those of JM Finn.


