

The American stock market has dominated equity performance tables for a number of years now. Drivers have included stronger US GDP growth, translating into stronger growth in the revenues of US companies, relative to Europe. The COVID-19 induced flush of monetary and fiscal support drove down interest rates and with it the discount rate, which leads to higher asset values, as explained later. And the more growth orientated and interest rate sensitive American stock market did better thanks to America’s high growth tech stocks being the source of substantial amounts of wealth creation and big contributors to the S&P500’s overall performance. With a relative overweight to tech compared to Europe, it is no surprise that America has done better.
Consensus opinion has it that the recent sell off in growth stocks has been driven by fears of inflation, which in turn have driven fears of higher discount rates. This is because growth assets are the most sensitive to interest rate movements and changes in the discount rate; you typically have to wait longer for the bulk of your cashflows following the purchase of a growth stock.
The sensitivity of growth to interest rates is explained as follows: the discount rate is the rate that you use to give a “today’s value,” or net present value, for a future cashflow. So £100 in a year’s time discounted at 10% is worth £100 ÷ (1+10%) = £90.91. If the discount rate of 10% goes up to 15% then the net present value of £100 shrinks to being worth £86.96. The risk free rate, or what you earn on government securities, is one of the drivers of the discount rate. So, all other things being equal, if interest rates go up by 1% then the discount rate should go up by 1% and the value of growth stocks should fall in value by more than the value of non-growth stocks. That is because the impact of time on the discount rate is exponential, which is why the more distant cashflows from growth stocks get hit hardest.
As the US has more than double the value of growth stocks than Europe, we would expect the US to be much more sensitive to changes in interest rates. And that is what we have observed.
We can see that the market is expecting interest rates to rise, specifically for the UK’s base rate to be close to 1% by the end of 2022 and the same for the Fed Funds rate. Note that rate expectations in Europe are significantly less aggressive which should, as discussed below, put less pressure on European stock markets to re-rate.
But what do we think interest rates are going to do and in particular ten year rates, which we believe to be more influential on stock market prices? That’s driven by our view on inflation, which we expect to moderate over the coming 12 months as consumption patterns normalise and supply chains are restored; and as base effects come out of the calculation.
Normalising consumption patterns will mean that services are consumed more, reducing the demand for goods which is where we are seeing most of the inflationary impact. Another component of normalisation is the idea that the surplus liquidity that was built up by government support schemes gets run down as it gets spent. Supply chains are compromised by workers being off sick, or isolating following contact with COVID-19 and these issues should ameliorate over time as the pandemic retreats. The large caveats or risks to that view are another COVID-19 variant and wage inflation picking up to a point where wages start driving inflation. The slow return to the employment market of the older and more COVID-19 wary cohorts of the workforce drives the risk higher.
The US ten year Treasury bond yield currently stands at 1.75%. In the UK, the ten year gilt yields 1.16%. Based on our expectations for inflation to peak in spring and then fall back, we estimate that the US ten year bond yield will probably rise to 2.10% by year end and the UK ten year gilt yield to 1.75%.
If we look at the long term charts of PE (price to earnings) ratio and interest rates then we can see a loose connection between the two. We use forward looking PE ratios because they tend to strip out the volatility of exceptional income, costs and tax rates.
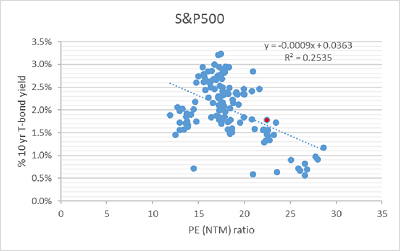
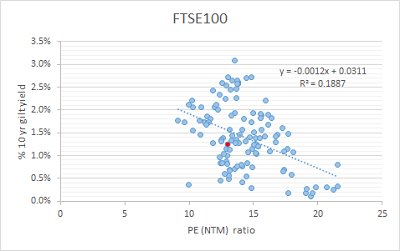
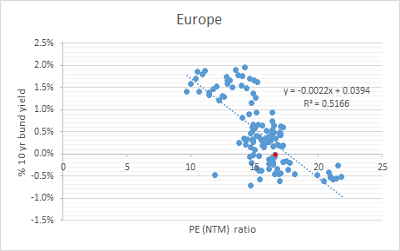
Source: Bloomberg
If we were to use this relationship as a guide to where PE ratios should be following a move to 2.10% in the US and 1.75% in the UK, then we find that forward looking PEs should fall as the table below illustrates.
Table A

Source: Bloomberg and JM Finn
But PE is not the only factor driving share prices. Earnings per share or EPS has an effect as well. GDP growth drives corporate revenues which in turn drives earnings or EPS higher. Our average estimates for EPS growth are shown above in Table A.
Factoring in the effect of EPS growth leaves us with an expectation that the US is likely to underperform the FTSE100 and Europe in 2022. This tallies with our observation that Europe is under-weight tech vs US and relatively overweight sectors such as industrials, financials, energy and materials which should outperform in an interest rate rising environment.
This view is supported by various long term valuation studies. America represents 61% of global stock market capitalisation but only 23% of global GDP. Some of that is explained by more American companies financing themselves with more equity vs debt, but it is still large. Another interesting metric is the fact that US equities are now at an all-time high of 200% of GDP.
In terms of risks to the above projections, on the bear side, we think that future falls in the US stock market will dent consumer demand due to the negative wealth effect. Added to which we don’t know the extent to which higher interest rates will make it less easy for growth companies to find cash to invest in their businesses and the extent to which lower demand for goods and services, a normal bi-product of higher rates, will drive lower growth.
On the bull side, we do notice a discrepancy between stronger revenue growth rates and EPS growth rates which could leave the S&P500 as a stronger performer than shown in Table A above. Post 2022 we would expect America’s more entrepreneurial culture and stronger GDP growth prospects to once again take the lead and drive a reversion to America leading the performance league tables.
We also note that our own expectations for stock market performance in Table A differ from the majority of institutional investors who seem to think that 5,000 is a more likely year-end target for the S&P500. This is close to the average for 4,950 expectation of seven major US banks.
There has been some research to show that the effect on PE de-ratings is much greater when interest rates are higher than where they are today. In short, stock markets can cope more easily when interest rates are below 5%.
So, on balance we think our “market maths” based year-end estimates in Table A are probably on the low side but we remain of the view that Europe will out-perform America in 2022.
John Royden, Head of Research
The value of securities and their income can fall as well as rise. Past performance should not be seen as an indication of future results. All views expressed are those of the author and should not be considered a recommendation or solicitation to buy or sell any products or securities.


